Summary: Both observability and monitoring play distinct roles in optimizing network performance: observability offers deep system insights, while monitoring provides real-time alerts based on predefined metrics.
Knowing how your network is set up helps you keep it available, protect access to company systems and data, and fix technical issues faster. But how can organizations effectively evaluate network performance? This blog explores two widely used approaches: observability and monitoring.
Read on to learn how observability and monitoring work, where each one fits best, and how to choose the right network analysis tools for your environment.
Key takeaways
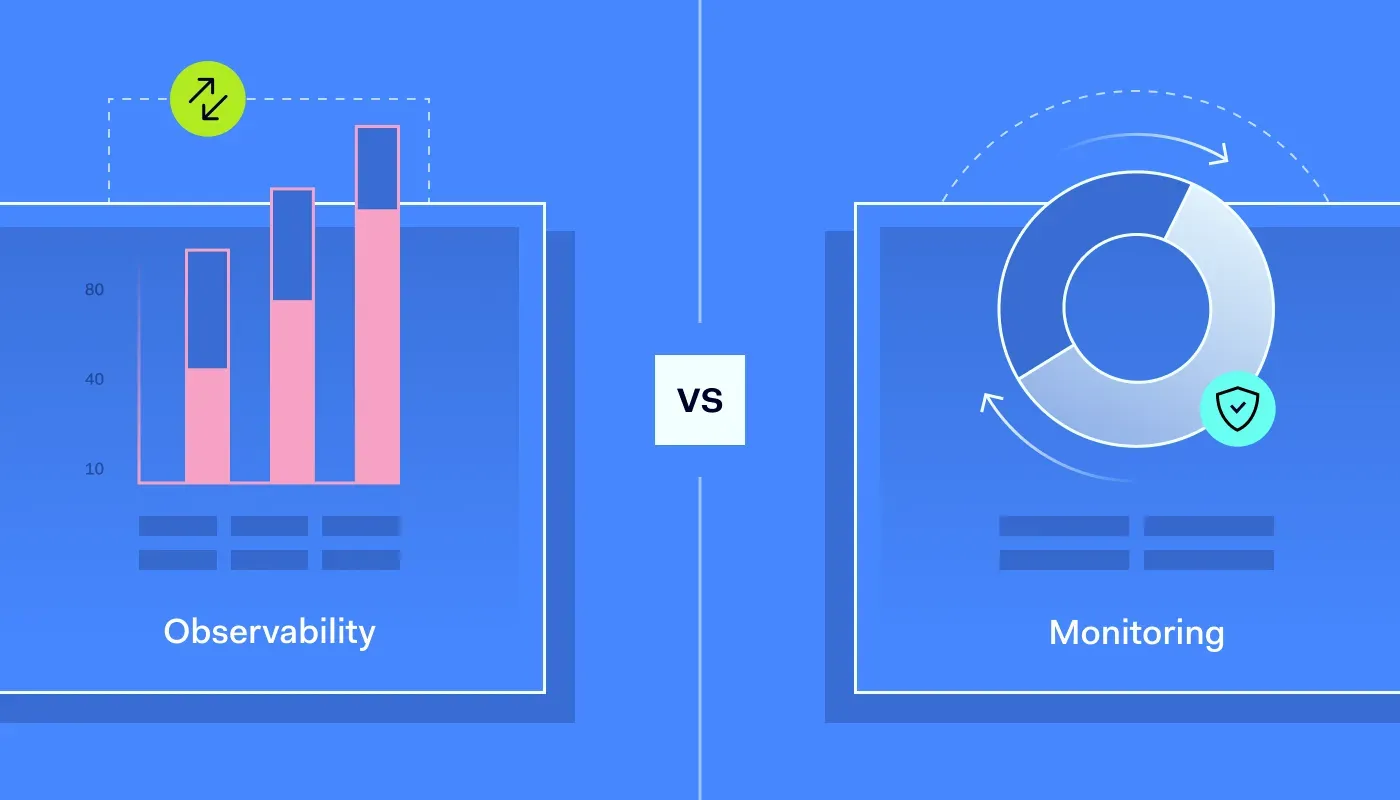
Observability vs. monitoring: They are both network visibility solutions that capture network data and diagnose issues. Observability platforms offer comprehensive insights into the internal state of systems. Monitoring tools are less complex, using predefined metrics and thresholds to assess network health.
When to use each: Observability systems enable flexible, interactive analysis, and monitoring tools are more rigid and rely on predetermined metrics. Observability tools provide deep insights into network behavior, while monitoring offers less detailed feedback. However, monitoring delivers instant insights and alerts. Observability tools take a slower, more analytical approach.
The criteria for choosing observability and monitoring: companies must assess specific needs and budget constraints. Observability platforms offer in-depth insights into complex technical challenges. They are ideal for distributed systems. Monitoring solutions provide real-time updates and alerts to enhance security and meet compliance goals.
What is monitoring?
Monitoring involves collecting and analyzing data to track the performance of an IT infrastructure or its individual components. In other words, it helps determine whether IT elements such as networks, systems, and services are operating as expected and meeting their core objectives. By using monitoring tools, IT teams can stay on track with their initiatives, make more informed decisions, and adapt quickly to changing conditions.
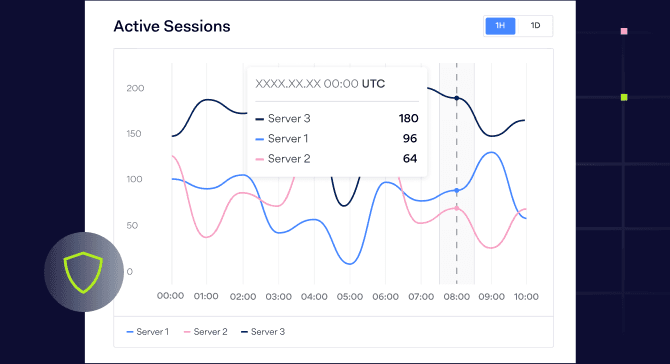
At the heart of monitoring are metrics—quantitative data measurements that reflect the performance of an IT environment and its services. For example, metrics can be applied to measure server response times, CPU usage, or network load levels, so that IT teams can identify issues early and ensure systems run efficiently.
Components of monitoring systems usually include:
Storage: Logging metrics in accessible, standardized formats.
Aggregation: Collecting data in relevant clusters or databases.
Visualization: Presenting logging data in a usable form for analysis and decision-making.
Automation: Scheduling automatic responses to monitoring outputs.
Detect issues, prevent breaches
Continuously monitor threats with NordLayer
What is observability?
Observability is the ability to understand the internal state of systems to assess their performance and make necessary changes. For example, cloud-native observability tools can identify security vulnerabilities and track system performance across multi-cloud environments.
Observability is also a guiding design principle for IT deployments. Systems built with observability in mind make monitoring and analysis easier, helping engineers maintain assets and implement network changes more efficiently.
At the same time, observability is an operational goal. Thanks to observability systems, managers can understand the context in which problems arise and take remedial action.
IT teams, on the other hand, use observability tools to gain insights into the status and performance of assets across an enterprise network. Concepts derived from control theory also influence observability practices by helping teams understand relationships between data centers, on-premises assets, cloud deployments, and remote devices. These tools use "three pillars" to observe and report on system health:
Logs: Text or numerical records of activity occurring within an IT system. Logs track what happened and when it happened. Logs may also cover contextual data such as user involvement.
Metrics: As discussed earlier, metrics are quantitative data points that track aspects of system performance.
Traces: Records of requests made within a network environment. Traces capture network calls, microservices, and databases used by each request. This information helps diagnose choke points and other network flaws.
Key differences: observability vs. monitoring
Though the difference between observability and monitoring might seem subtle, the two differ in several ways.
The key distinction lies in how tools process information. Monitoring tools assess predetermined metrics and thresholds, with users selecting the datasets in advance, which narrows their analytical frame.
By contrast, observability tools correlate signals accross systems and services to help teams understand system behavior and internal state. They can track many data flows and dependencies to support security and performance analysis, looking “inside” assets to reveal what’s happening across components.
| |
|---|
Observability platforms offer comprehensive insights into the internal state of systems | Monitoring tools are more limited, using predefined metrics and thresholds to assess network health |
Observability tools take a slower, more analytical approach | Monitoring delivers instant insights and alerts |
Observability platforms are ideal for distributed systems as they offer in-depth insights into complex technical challenges | Monitoring solutions provide real-time updates and alerts to enhance security and meet compliance goals |
Aside from that overarching distinction, differences between monitoring and observability include:
Flexibility: observability allows flexible and interactive interrogation of network performance. IT teams can apply multiple perspectives and tailor each analysis to find the root cause of network alerts. Monitoring is more rigid, relying on predefined metrics and visualization options to track system health.
Scope: observability platforms use high-level metrics, traces, and logs to generate system-wide insights. Monitoring uses aggregated data to deliver less detailed feedback about specific aspects of the IT environment.
Depth: an observability platform goes to the root of network problems. It works from the "inside out" to diagnose issues. Monitoring tools are more limited. They deliver alerts about IT infrastructure performance based on predetermined rules.
Speed: monitoring tools deliver insights in real time. They generate alerts regarding anomalies or security threats. Observability tools tend to take a slower, more analytical approach.
Related articles

Agnė SrėbaliūtėApr 26, 20247 min read

Agnė SrėbaliūtėAug 30, 20247 min read
Similarities between observability and monitoring
There are many differences between monitoring and observability. However, it's important to note some core similarities.
In practice, the two network management concepts complement each other. IT teams require observability and monitoring capabilities to optimize performance. Similarities include:
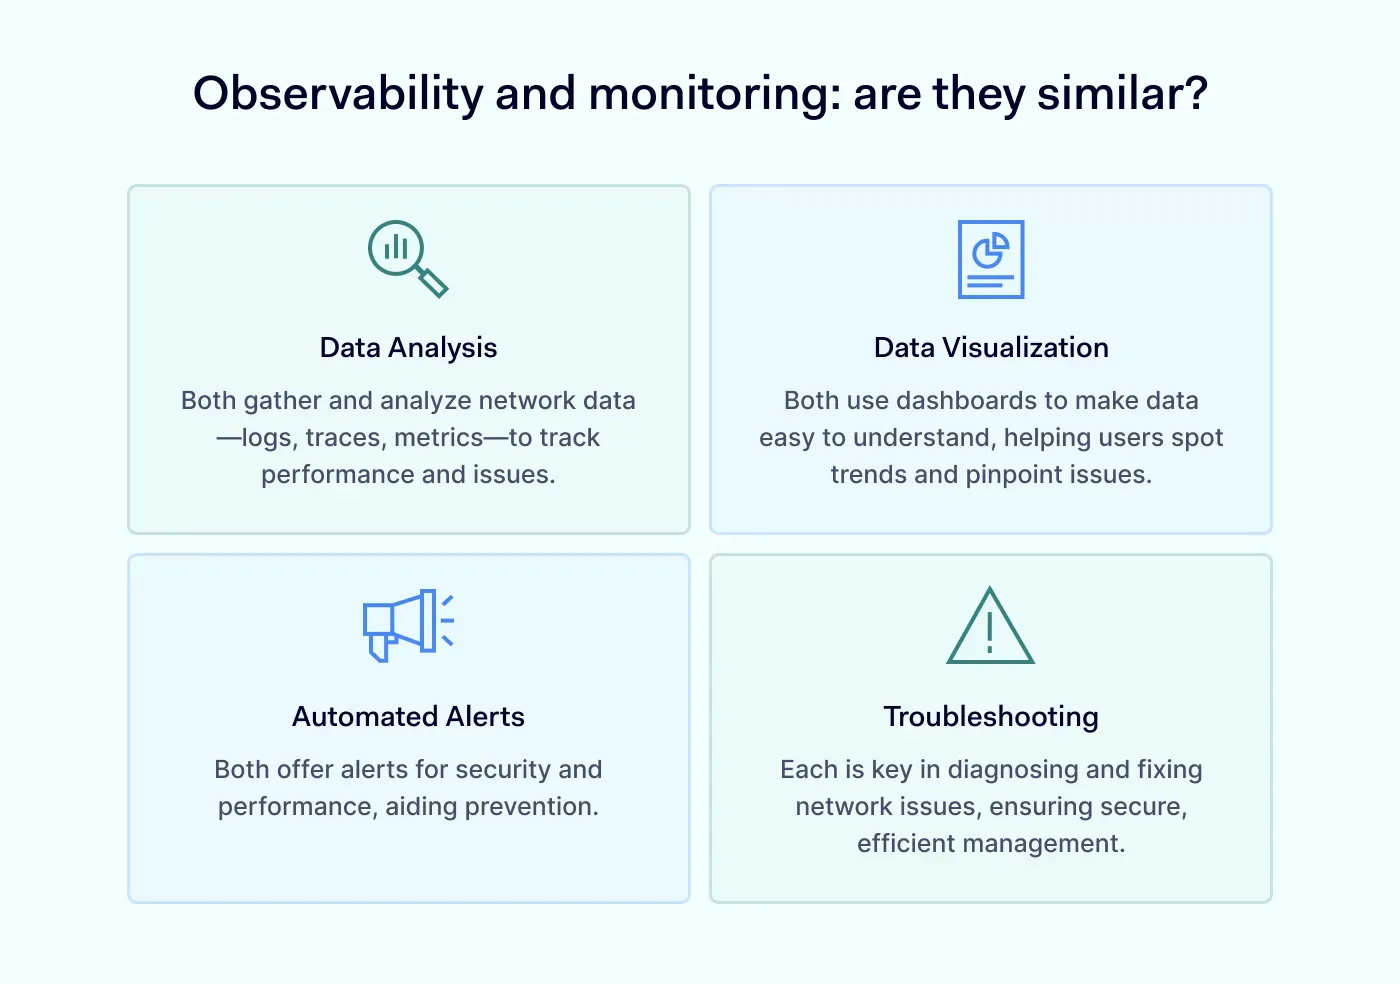
Data analysis: Both observability and monitoring solutions collect, organize, and analyze network data. They use a similar mix of logs, traces, and metrics. They also assess similar issues, including resource usage, error rates, and transaction response times.
Data visualization: Monitoring and observability tools must make information accessible and intelligible to users. Software generally includes external outputs like dashboards to present data. Intuitive data visualization allows users to note trends and identify areas of concern.
Automated alerts: Both concepts include an alert function. Automated analysis delivers alerts regarding security or performance issues. Alerts inform corrective actions and sharpen an organization's security posture, highlighting issues before they lead to vulnerabilities.
Troubleshooting: Observability and monitoring apply root cause analysis to fix network problems. Complex distributed systems rely on observation and real-time monitoring to identify flaws. Both tools feed into investigation processes. They also help meet regulatory standards for secure DevOps and network management.
When to apply observability, monitoring, or both
When planning their network setups, companies often face a common dilemma: although both observability and monitoring tools are considered vital for effective management, how should they prioritize if the budget doesn’t allow for both?
Fortunately, some network management solutions make it possible to implement a hybrid approach without a major cost increase. But what does a unified strategy look like? Let’s explore all the options—relying on monitoring alone, focusing on observability, or adopting a hybrid of the two—and examine the advantages and trade-offs of each.
When to use observability solutions
Observability is ideal for companies that require deep, actionable insights into the internal state of their networks. It provides a comprehensive view of complex, distributed environments, enabling teams to understand not just what is happening, but why. In other words, observability platforms allow organizations to use metrics, traces, and logs to analyze critical components and uncover hidden patterns or inefficiencies. As a result, they identify performance bottlenecks, predict potential failures, and proactively maintain network health.
Real-life example: A major global company deploys an observability platform across multiple countries, spanning both hybrid cloud and on-premises environments. Distributed agents collect performance data on client databases, data security, and data flow efficiency. This data enables the company to manage network loads effectively and maintain visibility over every device. Technicians can diagnose bottlenecks and address potential security weaknesses before they escalate into breaches.
When to use monitoring tools
Monitoring solutions are best suited for organizations that need real-time updates and immediate alerts to maintain network health and security. While monitoring generally provides a higher-level, less granular view than observability, it excels at tracking predefined metrics, detecting deviations from expected performance, and triggering notifications before small issues become critical. Monitoring is often simpler to implement and manage, making it a practical choice for organizations with limited IT resources or teams focused on operational continuity.
Real-life example: A small healthcare provider must safeguard its network assets to comply with HIPAA regulations. The company uses a network monitoring system to track device availability and monitor the status of protected health data. By establishing simple metrics—such as baseline tracking—and automating routine checks, the company reduces its IT workload while maintaining continuous oversight.
What happens when you implement both observability and monitoring
Observability and monitoring are not mutually exclusive; in fact, they work best when used together. Monitoring provides a structured way to track key metrics—such as server uptime or response times—against predefined thresholds, giving real-time insight into network health. Observability goes a step further, analyzing the contextual data collected through monitoring to uncover the root causes of incidents and understand how different components interact within the network.
By combining both approaches, organizations can create a comprehensive network analysis strategy. Monitoring data provides immediate awareness of issues as they arise, while observability enables teams to diagnose problems proactively and optimize system performance. Together, they help minimize downtime, improve operational efficiency, and ensure smoother, more reliable network operations.
Observe and monitor your network with NordLayer's help
Monitoring and observability tools empower organizations by collecting, aggregating, and analyzing information.
Network diagnostics rely on this knowledge to isolate flaws and identify the correct solution. And when knowledge is lacking, bad things happen. Without data collection systems, technicians handle every alert or outage on a case-by-case basis. That's hardly a recipe for efficiency or security.
Companies should take action to ensure network visibility and implement data collection solutions. NordLayer is ideally placed to help you achieve these goals.
NordLayer's solutions monitor network activity so you can take dynamic action before threats materialize or systems go down. Our visibility solutions enhance operational efficiency and help you protect data—two of the most pressing challenges for today's digital businesses.
Contact our team today and explore your network monitoring options. Understand every aspect of network activity, from suspect user connections to device posture management. And give your team the knowledge needed to respond when emergencies arise.

Agnė Srėbaliūtė
Senior Creative Copywriter
Agne is a writer with over 15 years of experience in PR, SEO, and creative writing. With a love for playing with words and meanings, she crafts content that’s clear and distinctive. Agne balances her passion for language and tech with hiking adventures in nature—a space that recharges her.

