Network observability solutions
See what’s happening across your network in real time. Get clear insights into activity, spot issues early, and keep your operations running without disruption.

14-day money-back guarantee
OVERVIEW
What is network observability?
Network observability is the process of monitoring and understanding what’s happening across your network in real time. It combines data from network traffic, user behavior, and system performance to give your IT teams a clear, complete picture of how your network operates.

Key benefits

Real-time visibility
Monitor network activity as it happens to help your team quickly identify network issues, performance gaps, and potential risks.

Improved security
Detect suspicious activity early – from failed logins to unusual behavior – and reduce the risk of breaches.

Centralized control
Manage and oversee your entire network from a single interface to simplify oversight and decision-making.

Actionable insights
Get clear insights you can act on to maintain optimal network performance and make informed decisions.
OBSERVABILITY IN ACTION
NordLayer’s Network Observability features
Network Observability is the process of monitoring what’s happening across your network in real time. With NordLayer, you get clear visibility into activity and devices, helping you spot issues early, reduce risk, and stay in control.
Failed logins
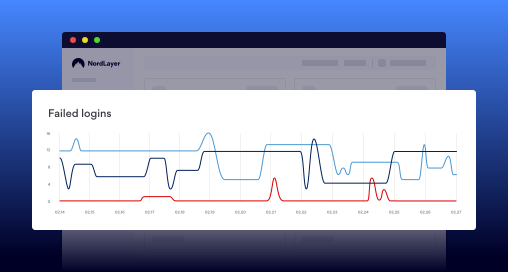
Monitor failed login attempts in real time to spot suspicious behavior early and stop unauthorized access before it becomes a real threat.
Device Posture Monitoring
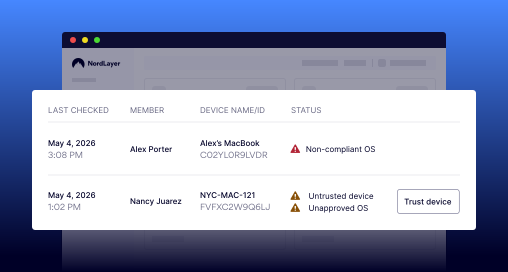
Check the security status of every device before it connects. Make sure that the devices meet your requirements to reduce the risk of unsafe or non-compliant access.
Activity data
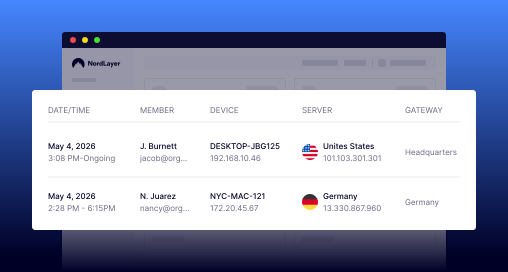
Track who is accessing your network, when, and from where. Gain better visibility into user behavior and quickly detect unusual patterns.
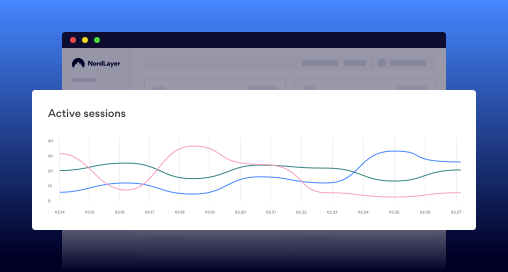
Dashboards
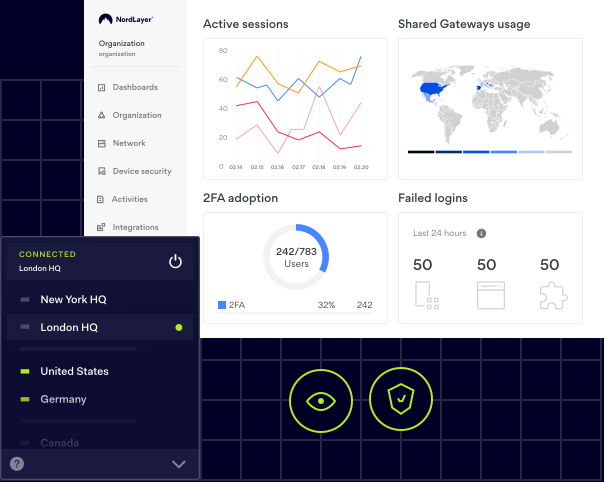
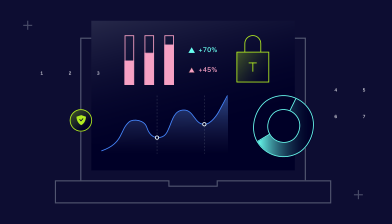
View all key network data in one place. Use simple, visual Dashboards to understand activity, monitor performance, and make faster decisions.
PAIN POINTS
Common network observability challenges
Poor visibility and scattered data make it harder to understand what’s happening across your network. As a result, issues go unnoticed, response times slow down, and risks increase.

Lack of visibility
Limited insight into network activity makes it harder to spot issues and potential threats in time.

Slow threat detection
Missed failed logins or unusual behavior can delay the response time, allowing threats to develop and increasing the risk.

Too much manual work
Spending too much time digging through logs or switching between disconnected tools slows down problem-solving and network operations.

Decisions without clear data
Without real-time, clear data, teams struggle to understand what’s happening, which leads to slower, less confident decision-making.

Challenges proving compliance
Proving security standards can be difficult without clear records, making audits and stakeholder reporting more time-consuming and complex.
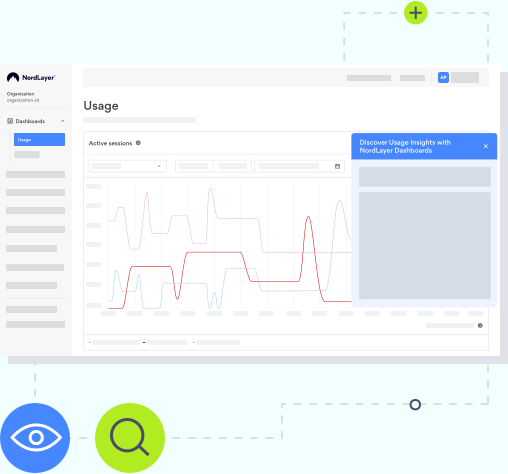
Get a real-time look at how NordLayer protects businesses
Explore features such as Cloud Firewall, Secure Web Gateway (SWG), Threat Protection, DNS Filtering, and Dedicated IP in real time with our interactive Control Panel demo.
USE CASES
What NordLayer’s Network Observability helps you achieve
Enable IT and security teams to proactively safeguard access, enforce zero trust, and maintain compliance through actionable login activity insights.

Reduced security risks
- Spot threats early Monitor failed login attempts to quickly detect unauthorized access or brute force activity before it escalates.
- Understand user behavior Identify unusual login patterns that may signal compromised accounts or insider threats.

Improved access control
- Manage access more precisely Use login data to identify suspicious activity and take appropriate action, such as adjusting access permissions or requiring additional verification.
- Support zero trust Continuously verify access based on real activity rather than assumptions to reduce risk.

Compliance and reporting
- Maintain clear audit trails Keep records of login activity to support compliance with regulations like GDPR and HIPAA and to simplify audits.
Get full visibility into your network with NordLayer
KNOWLEDGE HUB
Learn more about network observability
Additional info
Frequently asked questions
Network observability focuses on monitoring and understanding network activity, traffic, and access to ensure optimal performance and security. DevOps observability, on the other hand, focuses on applications and systems, helping teams track performance, errors, and behavior within software.
In short, network observability looks at how data moves across your network, while DevOps observability focuses on how applications run and perform.
Network performance monitoring focuses on tracking metrics like uptime, latency, and bandwidth across your network infrastructure to ensure everything is running smoothly. It provides basic network visibility into performance.
Network observability goes further by analyzing activity and behavior to help you understand why issues happen and how to fix them. You can read more about it here.
The 3 main types of observability are metrics, logs, and traces.
- Metrics show numerical data like traffic, latency, or error rates over time.
- Logs provide detailed records of events and activities within systems.
- Traces track how requests move through different parts of a system. Together, they give a complete view of system activity, supporting more effective network monitoring and troubleshooting.
You can find the failed logins widget and graph in the Control Panel under Dashboards → Security.
For more detailed information, go to the Activities tab, where you’ll see a full log of failed login attempts.
The failed logins log provides detailed context for each attempt, including:
- Name and email: who attempted to log in
- Date and time: when the attempt occurred
- IP address: where the attempt came from
- Platform: login source (Control Panel, NordLayer App, or Browser Extension)
- Login method: SSO or email and password
- Failure reason: what caused the login to fail
- Number of attempts: repeated attempts within a session
A failed login attempt is any unsuccessful attempt to access your account through the Control Panel, app, or Browser Extension. This can occur if you enter incorrect credentials, if SSO or 2FA fails, or if access is blocked by security policies.
No, there are no changes to the end-user experience.
The dashboard shows data from the last 24 hours and updates every 5 minutes, with almost no delay.
All NordLayer plans include logs of failed login attempts.