What is anomaly detection?

Every network has a rhythm. Monday morning logins spike at 9:00 AM, the backup server pushes terabytes every Sunday at 3:00 AM, and your developers consistently push code on Thursday afternoons. But then, something breaks the pattern. A marketing laptop starts scanning the internal network at midnight. A database that usually sleeps on weekends suddenly exports 5GB of data.
In such cases, standard security tools often fall short. They focus on known bad signatures. But what if the intruder is new, or behaves like a legitimate employee?
Anomaly detection definition
Anomaly detection is the process of identifying data points, events, or observations that deviate significantly from a dataset’s normal behavior. In cybersecurity, this means you establish a baseline of standard activity for users, hosts, and networks, then you flag patterns that stray far enough from that baseline to suggest a potential threat or malfunction.
Without effective anomaly detection, you are largely blind to “unknown unknowns,” for example zero-day attacks, insider threats, and slow-moving attacks that do not match known malware signatures. While signature-based tools look for what is explicitly known to be malicious, anomaly detection looks for what is strange.
How does anomaly detection work?
An anomaly detection system is a decision engine. It looks at a massive stream of telemetry and constantly asks, “Is this weird?” To answer that reliably without drowning your security operations center (SOC) in noise, the system follows a pipeline.
Establishing the baseline for anomaly detection
Before you can detect what is abnormal, you must define what is normal. Many anomaly detection techniques do this during a “training period,” especially when you use machine learning. The system ingests historical data, such as logs, network flows, and user activity, to build a profile.
For example, a machine learning model might learn that “User Alice” typically accesses the CRM system between 8 AM and 6 PM from an IP address in London. It learns variance too, effectively deciding that a login at 6:30 PM still fits the baseline, but a login at 3:00 AM is a statistical outlier among the data points.
This baseline can be:
- Static. Fixed after the training period (for example, “This server only talks to the database”).
- Dynamic. Continuously updated to reflect changing business needs (for example, “The marketing team is traveling, so foreign IP logins are temporarily normal”).
Scoring deviations in data analysis
Once the profile is set, the anomaly detection algorithms run on live data. They rarely output a simple “yes/no.” Instead, they usually assign an anomaly score, a numerical value that represents how far the current event is from the baseline.
In practical data analysis, if a server’s CPU usage spikes to 99%, that might score 40 (unusual, but maybe it is patch day). If that same server starts sending traffic to a suspicious country on a non-standard port, the score might jump to 95.
Evaluation and alerting in anomaly detection
High scores trigger alerts. However, the biggest challenge in detection methods is threshold tuning. Set it too low and analysts burn out chasing false positives (benign anomalies). Set it too high and you miss a hacker who exfiltrates data slowly.
Effective systems support feedback loops. When an analyst marks an alert as “false positive,” teams can use that feedback to adjust rules, thresholds, or retrain models, depending on how the anomaly detection tools implement learning and model updates.
Why is anomaly detection important?
Encrypted traffic, cloud sprawl, and changing malware make classic signature-based detection less reliable as a standalone approach. Attackers can change a file hash quickly. They can still hide, but it is harder to consistently hide the side effects of credential abuse, lateral movement, or unusual access paths across a real environment.
Detecting unknown threats with anomaly detection
Signature detection catches what you already know is bad. Anomaly detection catches what you have never seen before. This matters for zero-day exploits, where no vendor has released a patch or a signature yet. The exploit code might be novel, but the impact (for example, a web server spawning a command shell) can show up as a detectable anomaly.
Catching insider threats
A disgruntled employee or a compromised vendor account already has legitimate access. Their actions might not trigger malware alerts because they use standard tools (PowerShell, remote desktop protocol, and so on).
Anomaly detection helps you spot the behavioral shift. If an HR employee suddenly tries to access engineering blueprints, the anomaly detection system flags it not because the tool is malicious, but because the context is wrong.
Handling data at scale with machine learning
Modern enterprises generate massive volumes of logs and telemetry. It is not realistic to review them manually. Machine learning driven anomaly detection automates monitoring across these datasets, surfacing the most relevant statistical outliers for human review. It turns a noisy data swamp into a triage list an analyst can actually work.
Types of anomalies
Not all weird data is weird in the same way. Understanding the types of anomalies helps you choose the right approaches and tune your logic.
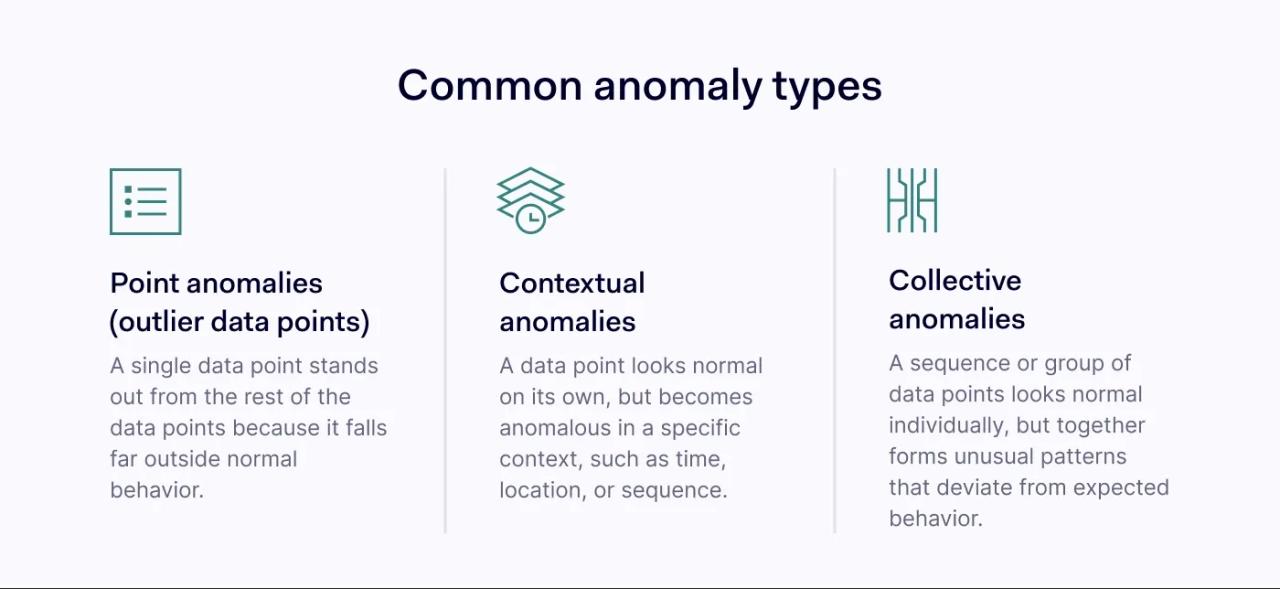
Point anomalies and outlier data points
These are the simplest deviations. A point anomaly occurs when a single data instance is anomalous compared to the rest of the data points.
Imagine a credit card bill. You usually spend $50 on groceries. Suddenly, there is a transaction for $5,000. That single transaction is a point anomaly.
Similarly, a server that normally transmits 10MB of data per day suddenly transmits 50GB in one hour. The volume makes this single event stand out against background noise.
Contextual anomalies in anomaly detection
These are more subtle. A data point is anomalous only when you view it within a specific context (time, location, or sequence), even if the value itself seems normal in isolation. Contextual anomalies are hard to catch without solid baselining.
An admin logging in at 2 PM is normal behavior. That same admin logging in at 2 AM is an anomaly. The event is identical (same credentials, same user), but the context of time makes it suspicious.
Collective anomalies and unusual patterns
A collective anomaly is a set of related data points that is anomalous compared to the overall dataset. The individual points might look normal on their own, but together they create unusual patterns.
One security example can be a “low and slow” brute force attack. A hacker tries one password every hour. Each individual login failure can be normal (people forget passwords). But the sequence of 24 failures over 24 hours from the same IP address creates a pattern that collective anomaly detection can flag.
Anomaly detection techniques
There is no single “master algorithm” for anomalies. Different data structures need different approaches. Security teams mix anomaly detection techniques to cover different threat vectors.
Statistical methods for data analysis
This is the old reliable approach to data analysis. Many methods assume that normal data roughly follows a distribution (often treated like a bell curve), at least for certain metrics.
How it works. You calculate the mean (average) and standard deviation of your data. Anything that falls many standard deviations away from the mean (a high Z-score) gets flagged.
Best for predictable metrics like CPU usage, disk space remaining, or the number of emails sent per hour.
Limitations. It struggles with complex, high-dimensional data analysis, or data that does not fit a neat distribution (which is common with spiky network traffic).
Isolation Forests in machine learning
This is a widely used algorithm designed for anomaly detection.
How it works. Many machine learning models learn what “normal” looks like. Isolation Forests take a different route: they try to isolate anomalies. The algorithm randomly splits data based on features. The idea is that anomalies are “few and different,” so they are easier to isolate (they need fewer splits) than normal points clustered together.
Best for high-dimensional datasets with many fields (IP, port, protocol, bytes, time). It often runs efficiently.
Why it matters. It detects outliers in large datasets without labeled “training data” (unsupervised learning).
DBSCAN and density-based detection methods
DBSCAN (Density-Based Spatial Clustering of Applications with Noise) looks for clusters of activity. It is a useful detection method when structure shows up as dense groups.
How it works. It groups together data points that pack closely. Any point in a low-density region (far from clusters) counts as an outlier.
Best for geospatial signals (for example, “impossible travel” patterns when you pair location with time) or identifying distinct groups of user behaviors.
If your users fall into clear groups (for example, office staff, remote staff, service accounts), DBSCAN can treat each group as normal in its own way. A single threshold rule (like “anything above X is weird”) can flag the remote group just because it looks different from office activity.
If normal behavior forms a weird shape (for example, activity that spikes during multiple work shifts), DBSCAN can still follow that shape. Methods that assume a bell curve can label those legitimate spikes as unusual patterns.
Key advantage. Unlike some statistical methods, it does not assume a bell curve. It can handle oddly shaped clusters of normal behavior.
Autoencoders and deep anomaly detection
For complex scenarios, teams use deep learning. An autoencoder is a neural network trained to compress data and then reconstruct it.
How it works. You train the network on “normal” data. It learns to compress and reconstruct that normal data with low error. When you feed it anomalous data, it reconstructs poorly because it has not learned those unusual patterns. The reconstruction error becomes the anomaly score.
Best for complex data where relationships between features are non-linear. For example, sensor time series, structured telemetry at scale, or packet payload analysis in environments where payload visibility exists (unencrypted, decrypted, or lab settings).
If something is only suspicious when you combine signals (for example, a normal-looking login plus unusual network traffic right after), autoencoders can catch the combo. Simple rules that check one field at a time can miss it.
If you have lots of fields per event (high-dimensional data), autoencoders can learn the overall “shape” of normal behavior. Handwritten rules often miss new variations, or they trigger too many false positives.
Use cases of anomaly detection
Anomaly detection tools can solve a range of problems across IT and business.
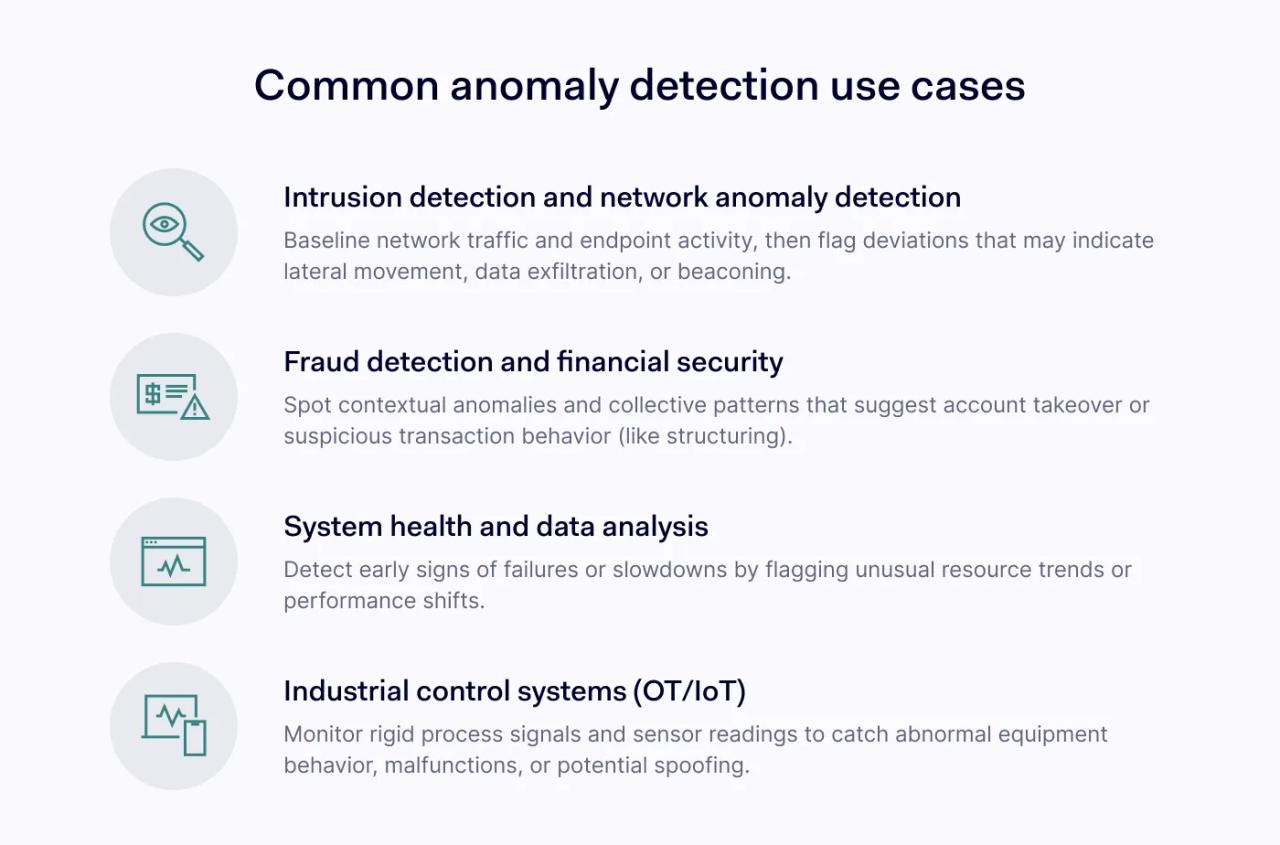
1. Intrusion detection and network anomaly detection
This is a core cybersecurity use case. Anomaly detection helps teams spot subtle signs of a breach thanks to baselining network traffic and endpoint activity.
- Lateral movement. Detecting when a user endpoint starts connecting to other endpoints using administrative ports (SMB/RDP), which breaks the usual client-server network traffic pattern.
- Data exfiltration. Identifying unusual patterns in outbound traffic, such as a DNS tunnel or an encrypted connection to an unknown cloud storage provider.
- Beaconing. Spotting regular, heartbeat-like connections to a command-and-control server, even when they hide inside otherwise legitimate web traffic.
2. Fraud detection and financial security
Banks adopted anomaly detection early. When a bank texts you asking, “Did you really spend $200 in Miami?” an anomaly detection system likely triggered that prompt.
- Account takeover. If a user usually logs in from an iPhone in New York but suddenly logs in from a Windows desktop in Nigeria, contextual anomalies can trigger an multi-factor authentication challenge, a step-up check, or a temporary hold, depending on policy.
- Transaction monitoring. Spotting “structuring” (smurfing), where hackers break large transfers into smaller, less suspicious amounts. Collective anomaly logic can catch these sequences.
3. System health and data analysis
Before a server crashes, it often wobbles. Anomaly detection can flag early warning signs of hardware and software issues.
- Resource exhaustion. Spotting a slow memory leak in an application. A signature-based tool will not catch it because memory use itself can look valid, but the trend (steady growth over weeks without release) is an anomaly revealed by data analysis.
- Application performance. Detecting that a specific database query now takes 300ms longer than usual. This lets DevOps teams fix inefficiencies before customers complain about slow load times.
4. Industrial control systems (OT/IoT)
In factories and power plants, “normal” is often rigid. A robotic arm moves X distance every Y seconds.
- Predictive maintenance. Analyzing vibration sensors on machinery. A slight change in vibration frequency can show up as a point anomaly that suggests a bearing will fail.
- Safety monitoring. If a temperature sensor reports a value that should not be physically plausible given readings seconds earlier, the system can flag a malfunction or a spoofing attempt.
The NordLayer Business Browser can support anomaly detection by adding browser-level signals that you can treat as data points in your data analysis. These signals include tracked visited domains, detected unapproved web applications (shadow IT), and content filtering events. It can also automatically route web traffic through gateways based on policies, which creates additional events you can correlate with unusual patterns in network traffic. While the Business Browser is not a standalone anomaly detection system, it is a helpful input source for anomaly detection tools.
The strategic value of anomaly detection
Implement anomaly detection to change how you use data, not just to buy a tool. It shifts teams from reactive work (wait for a known signature) to proactive work (investigate deviations). But anomaly detection is not magic. It needs ongoing tuning and care.
Managing false positives in detection methods
The kryptonite of any anomaly detection system is the false positive rate. If your system flags every legitimate software update as an “unusual file modification,” analysts stop trusting it. Tune your detection methods. Start with a high threshold (alert on the truly extreme cases), then lower it as you learn your environment. Use allowlisting for known administrative tasks so they do not skew the baseline.
The “concept drift” problem
Your business changes. You hire people, deploy new apps, and switch cloud providers. What was normal last month can look anomalous today, and vice versa. This is concept drift.
Anomaly detection algorithms need retraining, careful baseline refreshes, or continuous learning (dynamic profiling) to adapt. If you rely on a static model trained in 2023 to protect you in 2026, you will likely face a flood of alerts caused by legitimate changes.
The role of the analyst in anomaly detection
Machine learning can find a needle in a haystack, but humans decide whether that needle matters. Anomaly detection tools multiply analyst capacity, they do not replace judgment. They can point to the “what” and the “where,” but the analyst supplies the “why.”
Does that 3 AM login look suspicious? Yes. But the analyst checks the ticket queue and sees an emergency change request approved for that time. Context matters, and sometimes that context lives outside the logs.
Conclusion
Threats keep changing. Signature-based defenses still matter, but they rarely cover everything on their own. Anomaly detection adds a way to catch activity that has not been named yet.
You make it harder for an attacker to stay hidden if you understand normal behavior: the hum of your network, the habits of your users, and the performance of your applications. Hackers can steal credentials and mimic software, but they often slip when they try to copy the messy, real-world patterns of legitimate operations, and anomaly detection can surface that slip.
Start small. Pick one data source, perhaps authentication logs or egress firewall traffic, and apply outlier detection there. Do not try to boil the ocean. As you tune the system and reduce noise, track the change in alert volume and true positives week to week.